Analytics Test Page for the Zebellz Brand: A Research Initiative
Simple Research on Analytics


Hipwebcounter.com
FreeCounterStats.com
Introduction to the Analytics Test Page
The Analytics Test Page represents an innovative initiative designed specifically to capture invaluable analytical data pertaining to the Zebellz Brand. This initiative consists of a dedicated space where various metrics regarding user interactions and behavior can be effectively monitored and evaluated. The primary purpose of this analytical framework is to enhance the understanding of user engagement, which is crucial for optimizing brand strategies and improving overall performance.
Uniquely, the Analytics Test Page can only be accessed through a specific link available on the zebellz.net homepage. This exclusivity not only ensures that the data collected is relevant to actual users of the Zebellz Brand but also protects the integrity of the analytical metrics gathered. By limiting access, the initiative aims to create a controlled environment where user interactions can be observed without interference from external sources.
Participation in this research initiative is vital. Individuals visiting the Analytics Test Page contribute to the collection of empirical data, which can subsequently guide the decision-making process for the Zebellz Brand. This data serves as a feedback mechanism that informs strategic adjustments and allows for better alignment with consumer preferences. Therefore, engagement on this platform is not merely an act of visiting a webpage; it is an opportunity to influence the future direction of the brand through participatory research.
Tracking and Measuring Analytics: Tools Used
In the digital landscape, effective tracking and measuring of analytics are crucial to understand user behavior and enhance website performance. Several tools aid in this endeavor, each serving unique purposes and collectively contributing to a comprehensive analytics strategy. Among the most well-known is Google Analytics, which provides a robust set of features for tracking and analyzing web traffic. It can monitor user interactions, traffic sources, and engagement metrics, allowing businesses to filter data by demographics, location, and even the devices used. With its user-friendly dashboard, Google Analytics helps users visualize data trends with ease.
Another essential tool for web hosting analytics is often found in the platform’s built-in analytics feature. Many web hosts offer analytics dashboards that provide insights directly from the server level. These may include real-time data on site performance, traffic trends, and even server load metrics. This information is valuable for assessing how the website performs under different conditions and can highlight any shortcomings that might need addressing.
In addition to these mainstream solutions, external counters like FreeCounterStats.com and HitWebCounter.com can complement data gathered from web host analytics and Google Analytics. These services offer simple counters for tracking visitors and page views, serving as additional data sources to cross-reference against core analytics insights. By utilizing multiple tools, businesses gain a 360-degree view of user interaction and page visits, thereby creating a more accurate picture of how their online presence functions. The synergy between these various tools fosters better decision-making and enhances overall site optimization strategies.
Google Analytics
Hosting Analytics
January 27.2026
January 27.2026

Weekly Updates and Insights
The analytics research initiative for the Zebellz Brand will involve regular dissemination of insightful weekly updates. These updates will focus on sharing key metrics and findings derived from our ongoing analysis, which aims to track the brand’s performance and customer engagement trends. Each week, we will collate relevant data, including engagement rates, conversion metrics, and other pertinent analytics that provide a comprehensive view of our strategies’ effectiveness.
The shared insights will be interpreted within the context of our research objectives, offering an analysis that goes beyond the numbers. For instance, if we observe an increase in website traffic, we will explore potential reasons behind this trend, such as successful marketing campaigns or changes in consumer behavior. By doing so, we aim to furnish not only quantitative data but also qualitative insights that explain what the data signifies for the Zebellz Brand.
Furthermore, these weekly updates will highlight the significance of the findings for both the brand and the participants involved in the research. Participants will be informed of our methodologies, the reasoning behind specific data points, and their implications. This open line of communication fosters an environment of continuous engagement, allowing participants to feel invested in the research process. It also offers an opportunity to gather feedback, refine our analytics strategies, and adjust our approaches based on shared insights.
Ultimately, these weekly updates are designed to keep all stakeholders informed and agile in response to the dynamic analytics landscape. By providing clear and concise insights, we will facilitate data-driven decision-making that propels the Zebellz Brand forward.
Expressing Gratitude and Participation Follow-up
As we conclude this phase of the Analytics Test Page for the Zebellz Brand research initiative, it is essential to take a moment to express our heartfelt gratitude to each participant. Your involvement has been invaluable, and we sincerely appreciate the time and efforts you have dedicated to providing us with insights that will ultimately enhance the Zebellz Brand experience. We recognize that without your active participation, the depth of our findings would be significantly diminished.
If you are interested in staying updated on the outcomes of this research, we invite you to fill out a brief form designed to capture your contact information. This form will enable us to share the results and findings of the study with you directly. Your feedback and engagement are crucial, and we want to ensure that you are kept in the loop regarding the developments derived from your contributions.
Once the analysis is complete, we aim to share our findings on this blog, fostering a sense of community among all participants. We believe that transparency and open communication about the results can help build trust and collaboration as we move forward. By showcasing the findings, we hope to not only inform you about the insights gained but also to initiate further discussions on how these insights can be implemented to serve our community better.
Thank you once again for your participation in this research initiative. We value your support and look forward to sharing the exciting results soon. Together, we can continue to shape a brand that resonates with the desires and preferences of our engaged audience.
FEBUARY 3RD STATS/ANALYTICS
THE OUTCOME FOR FEB 3, 2026. THE 1ST WEEK
NOTE: The Zebellz Brand has done little to no advertising in all of its 5 years online.
February 3rd The findings for this week are as followed.
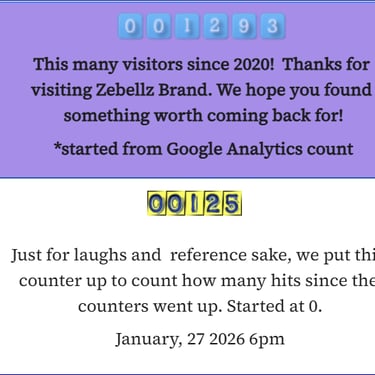
The counters that started off at 1,107 apart from one another, have gained a much broader distance apart. Knowing the page loads slower the further down the images/widgets are, the least likely anyone will see them. However, just like the image they are right on top of one another, thus the count being off is a mystery as of now.
On the 27th of January these front-page counters were at roughly (sorry the exact number was not taken) 1107 the blue and 62 the yellow. Today they show 1293 and 125. Their counts are now up by 186 and 63.
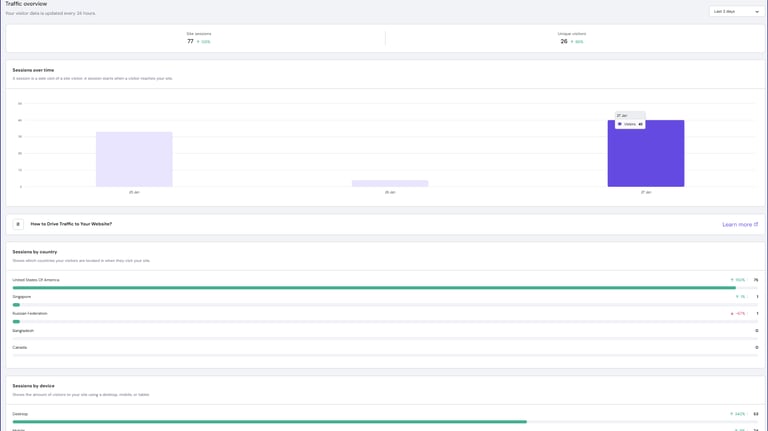
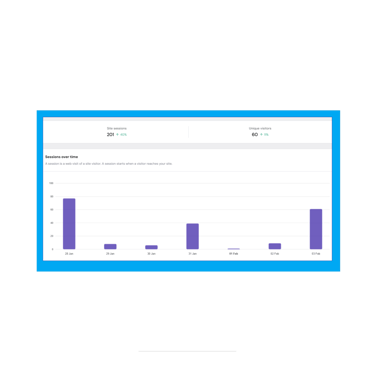
The host count for our front-page/landing page hits are probably combined with other pages similar to Google Analytics (GA) so, we will review those together.
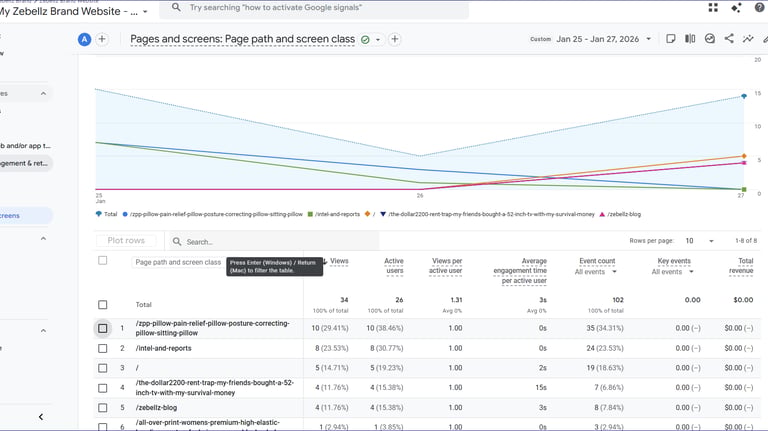
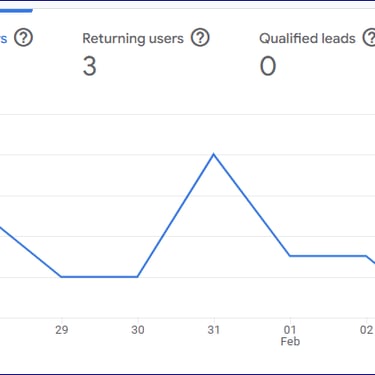
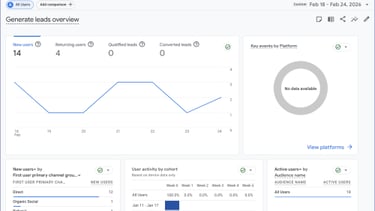
Host has 201 visits with 60 being new visitors. GA has 34 new users with some alarming data to go with those views that is not up for discussion here.
So, to analyze how or why the counts are so different is the key here. However, you are going to have to stay tuned to the last week of this research to find out on the 28th of February. This is when all the data is in and you will understand what we understand about Zebellz.net traffic and the entities who count our traffic.
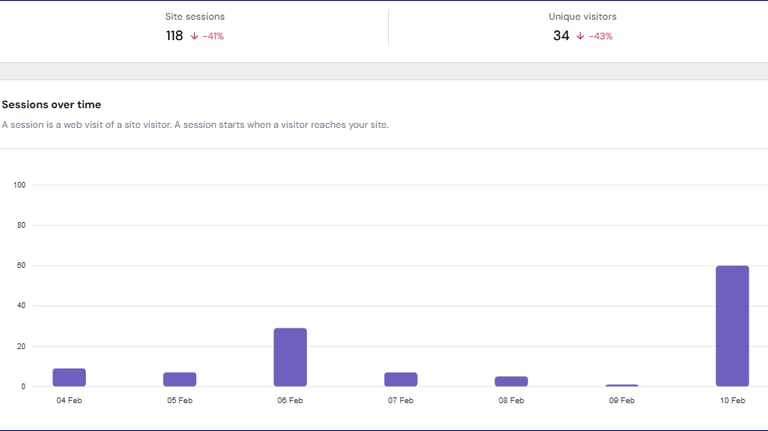
Febuary 10th Stats
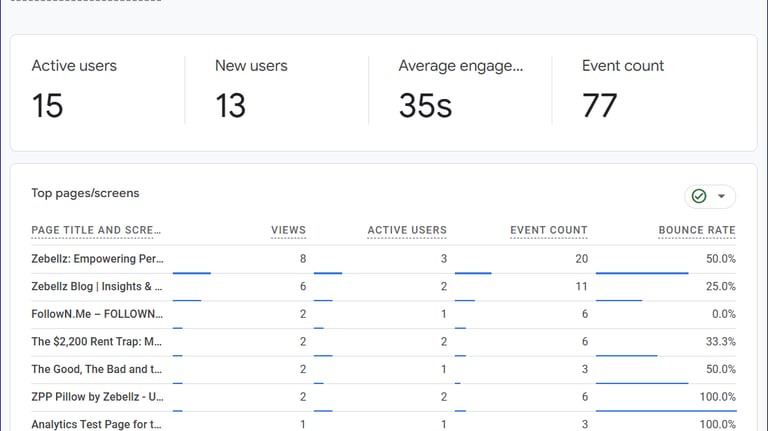
Google Analytics
Hosting Analytics
February 10, 2026
February 10, 2026
NOTE: Zebellz Brand only posts as projects are being completed on various social media sites. Some weeks we post nothing at all.
February 10th The findings for this week are as followed. The counters that started off at 1,179 apart from one another have gained an average of 75 hits or visits.
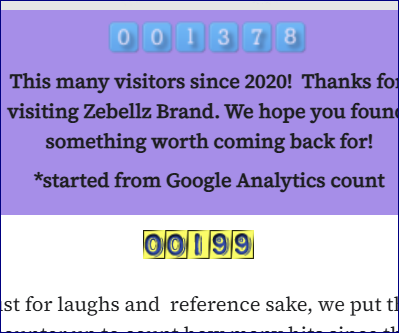
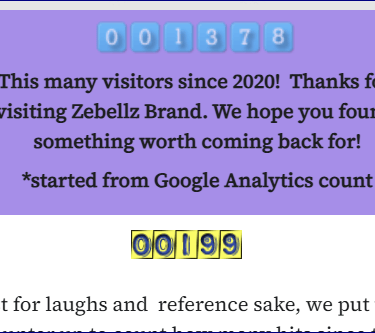
On the 27th of January these front-page counters were at roughly (sorry the exact number was not taken) 1107 the blue and 62 the yellow. Today they show 1378 and 199. Their counts are now up by 271 and 137.
As you know, we are counting the host count for the front page and other pages together, just as the google analytics does, so we are reviewing those together.
Host has 118 visits with 34 being new visitors. Google has 13 new users with their total being 15 visits. This weeks visitors has dropped by almost half the visitors of last week in both cases. That tells me that there is some accuracy in both their counting methods.
FEBUARY 17th Stats
Google Analytics
Hosting Analytics
February 17, 2026
February 17, 2026


NOTE:The Zebellz Brand has put out it's first book series this week. Check that out here
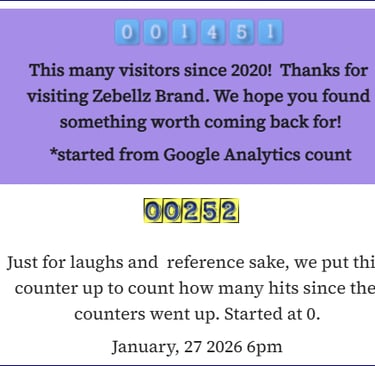
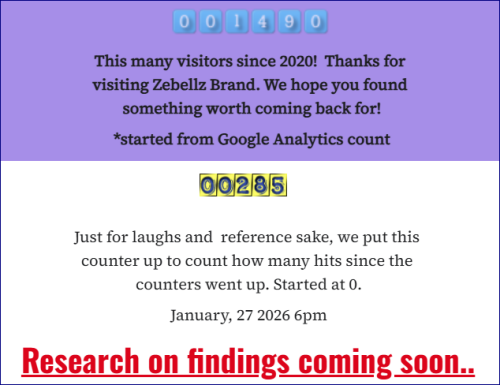
With the launch of the brand’s first book series, we observed a massive shift in how the "gatekeepers" interpret traffic. The counters have now gained a much broader distance. The Blue (HipWeb) has jumped to 1451 (up 344) and the Yellow (FreeCounter) is at 252 (up 190).
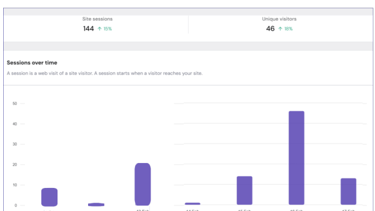
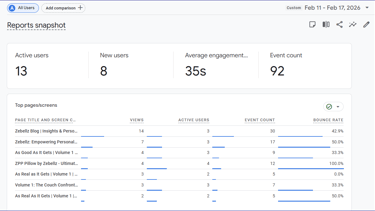
The Host logged 144 visits (43 new), but Google only recorded 13 new users. The "alarming data" in Google involves a high bounce rate that contradicts the steady growth in the server logs. It seems the further we go, the more we see that "traffic" is just an opinion. The server acknowledges the book announcement traffic, but Google is discounting it as "unqualified".
Febuary 24th Final Statistics
Google Analytics
Hosting Analytics
February 24, 2026
February 24, 2026
REASEARCH FINDINGS:
FEBRUARY 24TH FINAL STATISTICS
tl;dr: Digital tracking is a collection of filtered opinions. We stripped the fluff to find a real median of 136 monthly visitors.
The Calculations: To find the truth, we applied two layers of correction. First, we corrected the "double-count" habit of the external counters only. Second, we subtracted a 30% Editor footprint (190 visits for the host) from all four sources to remove internal administrative noise.
As for the conclusion of said research, it has been an amazing experience analyzing these counters and analytics. They all offered up different information on an ongoing basis. The findings are the following:
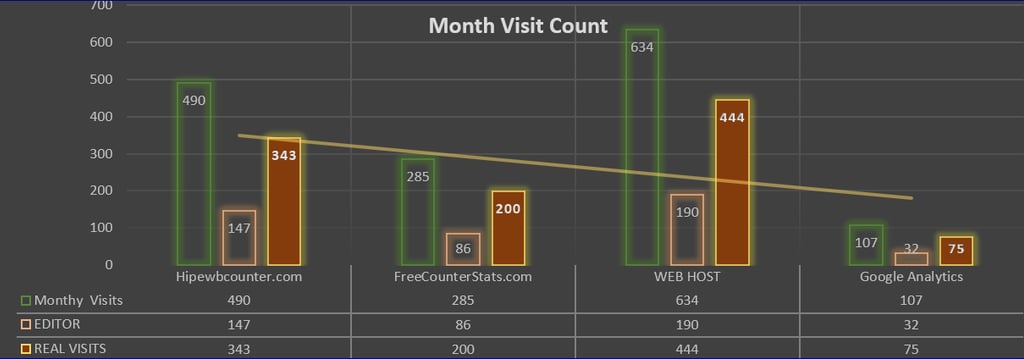
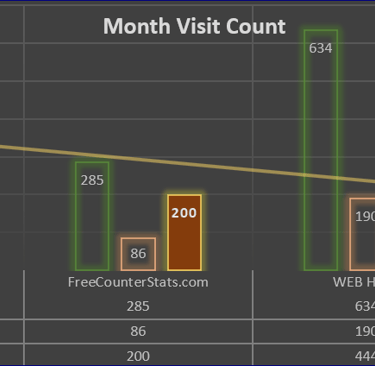
First the totals: Counters table "Month Visit Count", shows all of the figures together.
NOTE: Zebellz Brand only posts as projects are being completed on variouse social media sites. Some weeks we post nothing at all.
Simularities: The Shared Rhythm
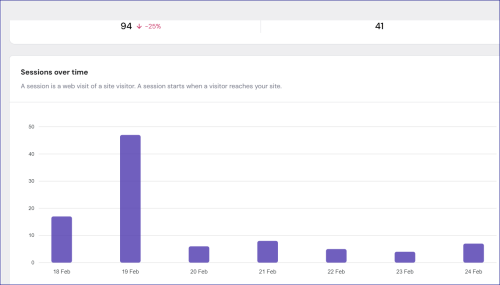
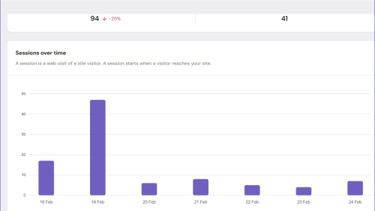
Despite the massive gaps in volume, the Simularities in the data show a shared rhythm. Every single tool—from the host to Google—tracked a nearly identical drop in activity during the week of February 10th. This proves that while these entities cannot agree on how many people are here, they all recognize the timing of the traffic. The heartbeat of the brand is visible even if the pulse-taker is broken.
Differentses: The Subjective Truth
The Differentses reveal that "viewership" is entirely subjective. There is no such thing as an "exact number" in web analytics; there is only the distance between the most liberal log (Host) and the most restrictive filter (Google).
Who is the Most Trusted?
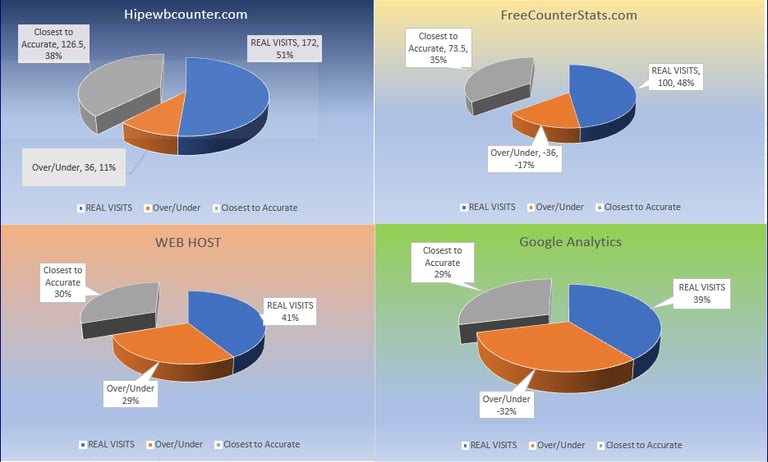
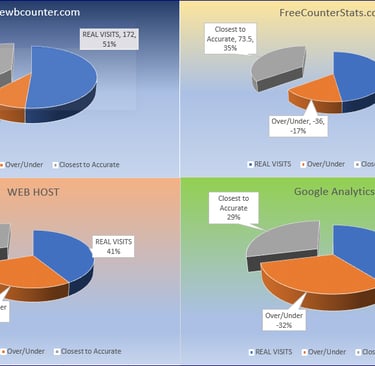
In this research, the low of means (the median) brought us to 136 visitors.
· The Winner: HipWebCounter (172) and FreeCounterStats (100) actually came the closest to the 136 median.
· The Result: By staying in the middle of the two extremes, these simple counters—once adjusted for their "double-count" fluff—actually provided a more realistic view of the Zebellz Brand than the "high-tech" analytics from the Web Host or Google.
Conclusion: If you want the truth, don't trust the biggest number or the most famous brand name. The most trusted data is found by looking at all of them and finding the center.+
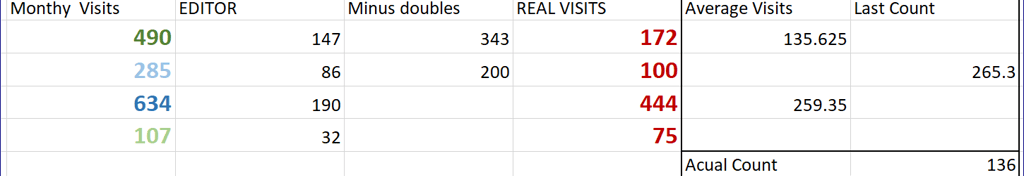
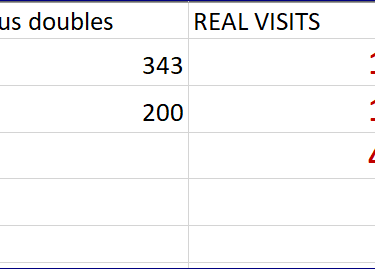
· Web Host: Logged a massive 634 monthly visits. After subtracting the 30% editor traffic (190), the REAL VISITS totaled 444.
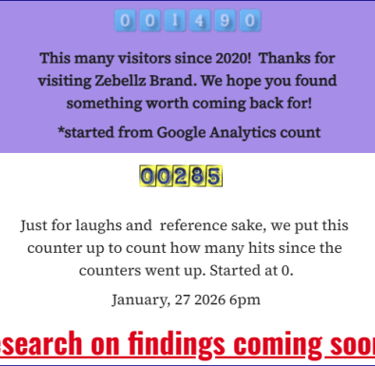
· HipWebCounter (Blue): Initial monthly count of 490. After a 50% reduction for double-counting and the editor cut, the total is 172.
· FreeCounterStats (Yellow): Initial monthly count of 285. Following the 50% double-count reduction and editor cut, the total is 100.
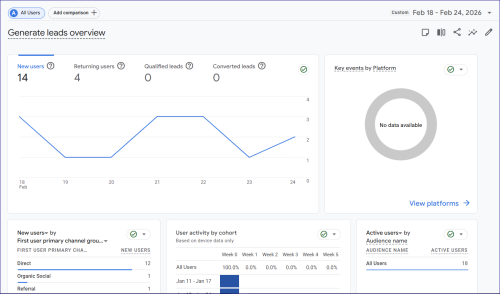
Google Analytics: Total of 107 visits. After the 30% editor filtering, the total is 75
The Percentage of Correctness: By comparing these numbers to our 136-visitor baseline, we found the "Percentage of Alike" for each entity:
· The Counters (74% Correct): Both the Blue and Yellow shared an identical 74% accuracy rating. One was over by 36, the other under by 36. This proves a shared logic that the corporate giants lacked.
· Google Analytics (55% Correct): Google "lied" through omission, ghosting 45% of our audience because it couldn't track them for its own ad-machine.
Differentses: The Subjective Truth
The Differentses reveal that "viewership" is entirely subjective. There is no such thing as an "exact number" in web analytics; there is only the distance between the most liberal log (Host) and the most restrictive filter (Google).


PREVIEW OF GOLDEN PISCES UNDERWARE COLLECTION. COMING SOON TO Shop.Zebellz.net, where art gets worn.
If you really want to get to the bottom of things, check out these men designer underware at Shop.Zebellz.net
Final Analysis:
The research proves that the more "advanced" a tool claims to be, the more it lies. The Web Host was off by 227%. Meanwhile, Google Analytics sits in its own ivory tower of deception—it doesn't just miscount, it actively decides who "exists" based on their value to Google's revenue. If Google can't monetize a user's data, that user is ghosted from your stats, resulting in a 55% correctness rate that leaves nearly half your audience in the dark.
The simple counters—once adjusted—stayed within a 26% variance, proving that "basic" is often more honest than "big tech". Trust the median, not the monitor. The truth isn't in one single number, but in the distance between them.
FEBRUARY 24TH: THE FINAL INTEGRITY AUDIT
tl;dr: Digital tracking is a collection of filtered opinions. We stripped the fluff to find a real median of 136 monthly visitors. We also caught the "Shared Brain" glitch that was doubling our counts.
The Calculations: Solving the Double-Count Mystery To find the truth, we applied two layers of correction. Through this research, we discovered that using the same counter code on multiple pages creates a "Shared Brain" effect—every time a visitor moved between the landing page and the analytics blog, the counter triggered twice for the same person.
To fix this "Mall Visitor" inflation, we applied a 50% reduction to the external counters. We then subtracted a 30% Editor footprint (190 visits for the host) from all four sources to remove internal administrative noise.
Web Host: Logged a massive 634 monthly visits. After subtracting the 30% editor traffic (190), the REAL VISITS totaled 444. (The host doesn't share a brain; it just logs every raw server handshake).
HipWebCounter (Blue): Inital monthly count of 490. After the 50% "Shared Brain" reduction and the 30% editor cut, the total is 172.
FreeCounterStats (Yellow): Inital monthly count of 285. Following the 50% "Shared Brain" reduction and editor cut, the total is 100.
Google Analytics: Total of 107 visits. After the 30% editor filtering, the total is 75.
The Percentage of Correctness: By comparing these numbers to our 136-visitor baseline, we found the "Percentage of Alike" for each entity:
The Counters (74% Correct): Both the Blue and Yellow shared an identical 74% accuracy rating. This proves that while they are "simple," their core logic—once you account for the "Shared Brain" setup—is remarkably consistent.
Google Analytics (55% Correct): Google "lied" through omission. If Google can't track a user for its own ad-machine, that user is ghosted. It actively decides who "exists" based on their value to Google's revenue.
Final Analysis: The Digital Footprint The research proves that the more "advanced" a tool claims to be, the more it lies. The Web Host was off by 227%, logging every bot and ghost in the machine. Google Analytics, sitting in its ivory tower, ignored nearly half the audience because they weren't "monetizable," resulting in a failing 55% correctness rate.
The simple counters—once we identified the double-triggering code—stayed within a 26% variance. We have now moved to a "one per whatever" system, giving each Hub its own unique code and its own Digital Footprint. No more shared brains. Trust the median, not the monitor. The truth isn't in one single number, but in the distance between them.